Difference between revisions of "Machine Details Page"
m (Initial content population) |
(Populated a bunch of content. Still need to add lots more) |
||
| Line 9: | Line 9: | ||
=== Machine Utilization === | === Machine Utilization === | ||
| − | + | The machine utilization page provides detailed information on how a machine has been used. The page is broken down into four main sections: | |
| + | * Map area | ||
| + | * Settings area | ||
| + | * Chart area | ||
| + | * Table area | ||
| + | each area is described in the following subsections. | ||
| − | ==== Graph | + | ==== Map area ==== |
| + | |||
| + | The map area gives an overview of where the machine was physically located when it was last in contact with the Dyn@Link server. | ||
| + | |||
| + | ==== Settings area ==== | ||
| + | |||
| + | In the settings area, you can select the length of time to generate the graph for. Your are able to select one of the following ranges of time: | ||
| + | * 1 day | ||
| + | * 1 week | ||
| + | * 1 month | ||
| + | Once you have selected a range of time, you are able to select the start for this range of time. For example if you select 1 week, then 24/9/2019 you will get a graph that shows the utilization data for an entire week starting on 24/9/2019. | ||
| + | |||
| + | ==== Chart area ==== | ||
| + | |||
| + | The chart area shows two pi charts, side by side. On the left side, the chart shows the utilization over the time period that you selected in the [[#Settings area|settings area]]. On the right side, the chart shows the utilization of the machine over the lifetime of the machine. In the upper right of each chart there is a small symbol with three lines, if clicked this allows you to download the graphic. | ||
| + | |||
| + | Depending on what type of machine you are using the charts will change slightly. To understand what each section of the chart represents please consult the corresponding section below. | ||
| + | |||
| + | ===== Pavers ===== | ||
| + | |||
| + | When a paver has been selected the graph will show three sections, titled: | ||
| + | * Static/Transport | ||
| + | * Idle | ||
| + | * Paving | ||
| + | |||
| + | [[File:2020-03-24 10 24 03-Machine Details.png|Paver Utilization Graph]] | ||
| + | |||
| + | In the following sections you can see how each of these values is calculated. | ||
| + | |||
| + | ====== Static/Transport ====== | ||
| + | |||
| + | ====== Idle ====== | ||
| + | |||
| + | ====== Paving ====== | ||
| + | |||
| + | For a paver to be considered paving, it must meet the following conditions: | ||
| + | * Driving forward | ||
| + | * Not in Transport mode | ||
| + | * Vibration or tamper is active | ||
| + | * Screed is set to floating | ||
| + | |||
| + | ===== CA Rollers ===== | ||
| + | |||
| + | When a CA roller has been selected the graph will show three sections, titled: | ||
| + | * Static/Transport | ||
| + | * Idle | ||
| + | * Vibrating | ||
| + | |||
| + | [[File:2020-03-24 10 18 58-Machine details.png|CA Utilization Graph]] | ||
| + | |||
| + | In the following sections you can see how each of these values is calculated. | ||
| + | |||
| + | ====== Static/Transport ====== | ||
| + | |||
| + | ====== Idle ====== | ||
| + | |||
| + | ====== Vibrating ====== | ||
| + | |||
| + | ===== CC Rollers ===== | ||
| + | |||
| + | When a CA roller has been selected the graph will show three sections, titled: | ||
| + | * Static/Transport | ||
| + | * Idle | ||
| + | * Vibrating | ||
| + | |||
| + | [[File:2020-03-24 10 18 40-Machine details.png|CC Utilization Graph]] | ||
| + | |||
| + | ==== Table area ==== | ||
=== Raw CAN-bus Data === | === Raw CAN-bus Data === | ||
Revision as of 09:33, 24 March 2020
Contents
Overview
To navigate to this page click on a machine in the Dashboard view. In this page further information specific to a unique machine can be found. The following sections elaborate on the information found within each tab, on the machine details page.
Machine Data
This is about machine data
Machine Utilization
The machine utilization page provides detailed information on how a machine has been used. The page is broken down into four main sections:
- Map area
- Settings area
- Chart area
- Table area
each area is described in the following subsections.
Map area
The map area gives an overview of where the machine was physically located when it was last in contact with the Dyn@Link server.
Settings area
In the settings area, you can select the length of time to generate the graph for. Your are able to select one of the following ranges of time:
- 1 day
- 1 week
- 1 month
Once you have selected a range of time, you are able to select the start for this range of time. For example if you select 1 week, then 24/9/2019 you will get a graph that shows the utilization data for an entire week starting on 24/9/2019.
Chart area
The chart area shows two pi charts, side by side. On the left side, the chart shows the utilization over the time period that you selected in the settings area. On the right side, the chart shows the utilization of the machine over the lifetime of the machine. In the upper right of each chart there is a small symbol with three lines, if clicked this allows you to download the graphic.
Depending on what type of machine you are using the charts will change slightly. To understand what each section of the chart represents please consult the corresponding section below.
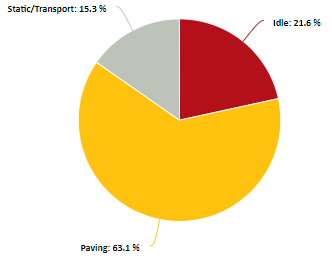
Pavers
When a paver has been selected the graph will show three sections, titled:
- Static/Transport
- Idle
- Paving
In the following sections you can see how each of these values is calculated.
Static/Transport
Idle
Paving
For a paver to be considered paving, it must meet the following conditions:
- Driving forward
- Not in Transport mode
- Vibration or tamper is active
- Screed is set to floating
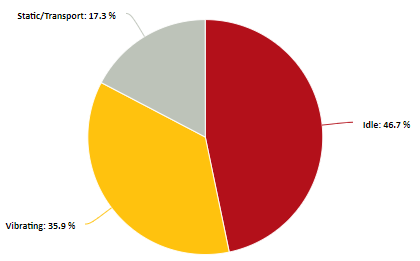
CA Rollers
When a CA roller has been selected the graph will show three sections, titled:
- Static/Transport
- Idle
- Vibrating
In the following sections you can see how each of these values is calculated.
Static/Transport
Idle
Vibrating
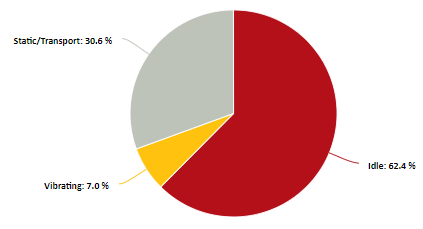
CC Rollers
When a CA roller has been selected the graph will show three sections, titled:
- Static/Transport
- Idle
- Vibrating


