Difference between revisions of "Machine Details Page"
(added section relating to list population with all errors.) |
m (added more spacing so it looks a bit nicer.) |
||
| (One intermediate revision by the same user not shown) | |||
| Line 102: | Line 102: | ||
==== Full CAN Bus Report ==== | ==== Full CAN Bus Report ==== | ||
This report is available for high level users. It shows a historical view of the errors. By default, the errors are listed in a table, in sequential order, with the newest at the top of the list. If the same error keeps repeating every minute, without any other errors in between, then the list will only show the last time it was reported. | This report is available for high level users. It shows a historical view of the errors. By default, the errors are listed in a table, in sequential order, with the newest at the top of the list. If the same error keeps repeating every minute, without any other errors in between, then the list will only show the last time it was reported. | ||
| − | If you are required to see all of the errors, including the repeated ones, please click the link that says "Show list with duplicates". After clicking this, it could take a long time to populate the list (up to several minutes). Once the page loads, you will see all errors that were reported from the machine. | + | [[File:2020-09-28_09_31_44-Full_CAN-bus_Error_Report.png|200px|thumb|left]] If you are required to see all of the errors, including the repeated ones, please click the link that says "Show list with duplicates". After clicking this, it could take a long time to populate the list (up to several minutes). Once the page loads, you will see all errors that were reported from the machine. |
| + | |||
| + | |||
| + | |||
=== Notes === | === Notes === | ||
Latest revision as of 07:35, 28 September 2020
Contents
Overview
To navigate to this page click on a machine in the Dashboard view. In this page further information specific to a unique machine can be found. The following sections elaborate on the information found within each tab, on the machine details page.
Machine Data
Machine Utilization
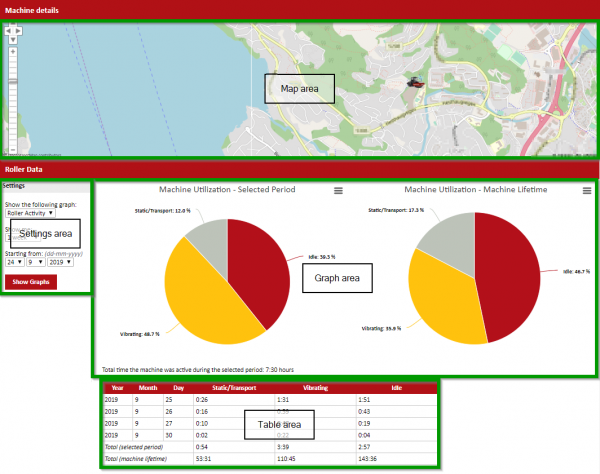
The machine utilization page provides detailed information on how a machine has been used. The page is broken down into four main sections:
- Map area
- Settings area
- Chart area
- Table area
each area is described in the following subsections.
Map area
When viewing the map area, in the machine utilization, the map gives an overview of where the machine was physically located/working during the selected period (settings area).
Settings area
In the settings area, you can filter the length of time to generate the graph for. Your are able to select one of the following ranges of time:
- 1 day
- 1 week
- 1 month
Once you have selected a range of time, you should select the start for this range of time. For example if you select 1 week, then 24/9/2019 you will get a graph that shows the utilization data for an entire week starting on 24/9/2019.
Chart area
The chart area shows two pi charts, side by side. On the left side, the chart shows the utilization over the time period that you selected in the settings area. On the right side, the chart shows the utilization of the machine over the lifetime of the machine. In the upper right of each chart there is a small symbol with three horizontal lines (![]() ), if clicked this allows you to download the graphic.
), if clicked this allows you to download the graphic.
Depending on what type of machine you are using the charts will change slightly. To understand what each section of the chart represents please consult the corresponding section below.
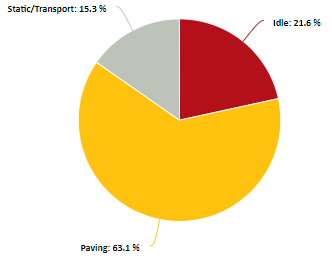
Pavers
When a paver has been selected the graph will show three sections, titled:
- Static/Transport
- Idle
- Paving
In the following sections you can see how each of these values is calculated.
Static/Transport
Hours are accumulated when the following conditions are met:
- Engine RPM >= 1100 rpm (greater than 1100 RPM)
As an example, heating the screed or moving between job sites.
Idle
Hours are accumulated when the following conditions are met:
- Engine RPM < 1100 rpm (less than 1100 RPM)
Paving
Hours are accumulated when the following conditions are met:
- Driving forward
- Not in Transport mode
- Vibration or tamper is active
- Screed is set to floating
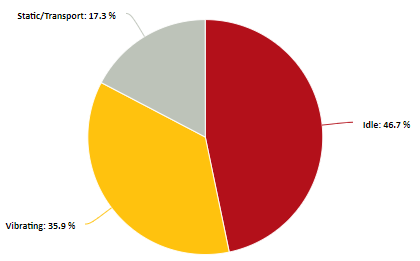
Rollers
When a roller has been selected the graph will show three sections, titled:
- Static/Transport
- Idle
- Vibrating
In the following sections you can see how each of these values is calculated.
Static/Transport
Hours are accumulated when the following conditions are met:
- Engine is on
- Vibration is off
- Machine is not in Neutral
Idle
Hours are accumulated when the following conditions are met:
- Engine is on
- Machine is in neutral
Vibrating
Hours are accumulated when the following conditions are met:
- Vibration is turned on
Table area
This area explicitly shows the values that are used to create the Pie Charts. A summary of the values for the selected period is shown in the second to last row of the table. In the final row of the table, the total values for the lifetime of the machine are shown.
Alerts
Full CAN Bus Report
This report is available for high level users. It shows a historical view of the errors. By default, the errors are listed in a table, in sequential order, with the newest at the top of the list. If the same error keeps repeating every minute, without any other errors in between, then the list will only show the last time it was reported.
If you are required to see all of the errors, including the repeated ones, please click the link that says "Show list with duplicates". After clicking this, it could take a long time to populate the list (up to several minutes). Once the page loads, you will see all errors that were reported from the machine.


